
The time has come for the PCC/APC models to start being implemented, changing the way populations and their scores shape up. With the PCC model now including the additive risk scores for the condition count, CMS has decreased many of the individual HCC risk scores used in the current model—for instance diabetes will see a 14% decrease, with reductions counterbalanced by an increase in other risk scores. The change led us to do a statistical analysis that assessed the impact of these substantial changes.
The decreases set to occur for the more prevalent HCCs brings into question the potential impact on an individual member’s HCCs, especially whether or not the new additive risk scores make up the difference.
Side By Side
By pulling together a population of 20,000 community members—a mix of CN, CF, and CP risk factor types—from Episource’s data pool, we were able to analyze and compare the 2017, 2019 and 2020 models. This made it possible to spot trends created by the new models and answer questions like: what kind of an impact could the new scores have on members with only one to three HCCs?
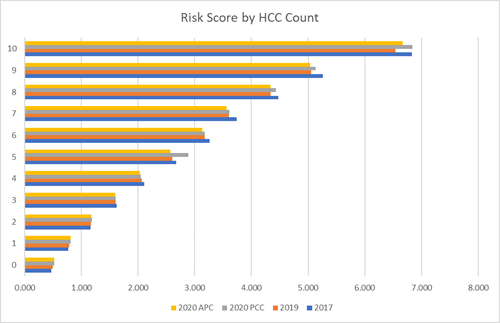
Under the soon-to-be-implemented models, demographic risk scores start out higher at younger ages, which seems to help with the variance between the 2019 risk scores in comparison to the 2020 PCC as well as APC risk scores. Indeed, in the sample population that was tested there was not much of an impact for members with zero HCCs and, in fact, initial calculations saw a slight increase for these members. As the number of HCCs grew, those HCCs that saw a dramatic decrease began to take their toll on the average risk scores.
Trending Downward
So far, in members with one to three HCCs there is a decrease in the risk score for the HCCs, but this is not a big surprise. CMS prepared us for this decrease. However, things get more interesting when a beneficiary reaches four HCCs. At this point, the sample population saw a lower risk score in comparison to the 2017 model as well as the current 2019 model. The variance between 2017 and the 2020 PCC model was -2.6%, which shifted to -3.6% for the 2020 APC model. As the HCC count increased, the 2020 PCC and APC models both saw higher risk scores in comparison to the 2019 model but continued to be below the 2017 model in most cases.

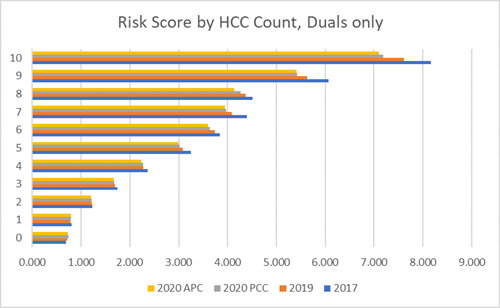
In the sample population data set used, the members that had the highest decrease on average were the dual members. At three HCCs the risk score started to see a higher negative variance in comparison to previous models, which increased further the more HCCs a member had. Even bringing in the additive risk score for HCC counts did not make up for the variance as it did for the overall population. Members with a risk adjustment factor type of CF had an average risk score variance of -4.3% in comparison to the 2017 Model and -2.1% compared to the 2019 Model risk scores.
A Bright Side
The good news is that with the increase to the demographic risk scores and added diagnosis codes and HCCs, the 2019 and 2020 models had a higher average risk score in comparison to the 2017 model. This has a lot to do with how the majority of the population sits in those areas where the risk scores favor the 2020 model. In the sample population 79% of the members had less than four HCCs.
Overall, the new model will have similar average risk scores to the 2017 model. Yet, as the number of HCCs increases, there may be an impact in comparison to previous years, albeit a positive impact in comparison to the 2019 model. However, a lot of this will be dependent on the specific HCCs of the population and the RAF type code.
This data set can be used to provide one sampling of the models, but it’s important to take time now to apply these developments to your own populations and answer these critical questions:
- What HCCs are most prevalent in your risk adjustment population?
- Will those HCCs see a decrease in the risk score?
- And most importantly, how many HCCs will it take for you to see an impact at an individual member level?
Sample population was 20k members with a mixture of CN, CF, and CP risk adjustment factor types.